Matplotlib 等值线图自定义 label 标签位置
在用 Matplotlib 绘制等值线图时,经常要在等值线上打上标签,表示这条线的数值是多少。
默认打标签
默认情况下,Matplotlib 会根据实际情况自动标注标签,但是这样的标签位置比较分散。
比如下面这个代码:
# -*- coding: utf-8 -*-
import numpy as np
import matplotlib.cm as cm
import matplotlib.pyplot as plt


# 创建等值线数据
delta = 0.025
x = np.arange(-3.0, 3.0, delta)
y = np.arange(-2.0, 2.0, delta)
X, Y = np.meshgrid(x, y)
Z1 = np.exp(-X**2 - Y**2)
Z2 = np.exp(-(X - 1)**2 - (Y - 1)**2)
Z = (Z1 - Z2) * 2

fig = plt.figure(figsize=(16, 9))

ax = fig.add_subplot(111)
# 等值线 LEVEL
levels = np.arange(-1, 1.8, 0.1)
# 绘制等值线
CS = ax.contour(Z, levels, linewidths=2, colors="black")
# 打标签
ax.clabel(CS, inline=True, fontsize=20)

ax.set_title('contour clabel demo')
fig.savefig("test.png", dpi=200, bbox_inches='tight')
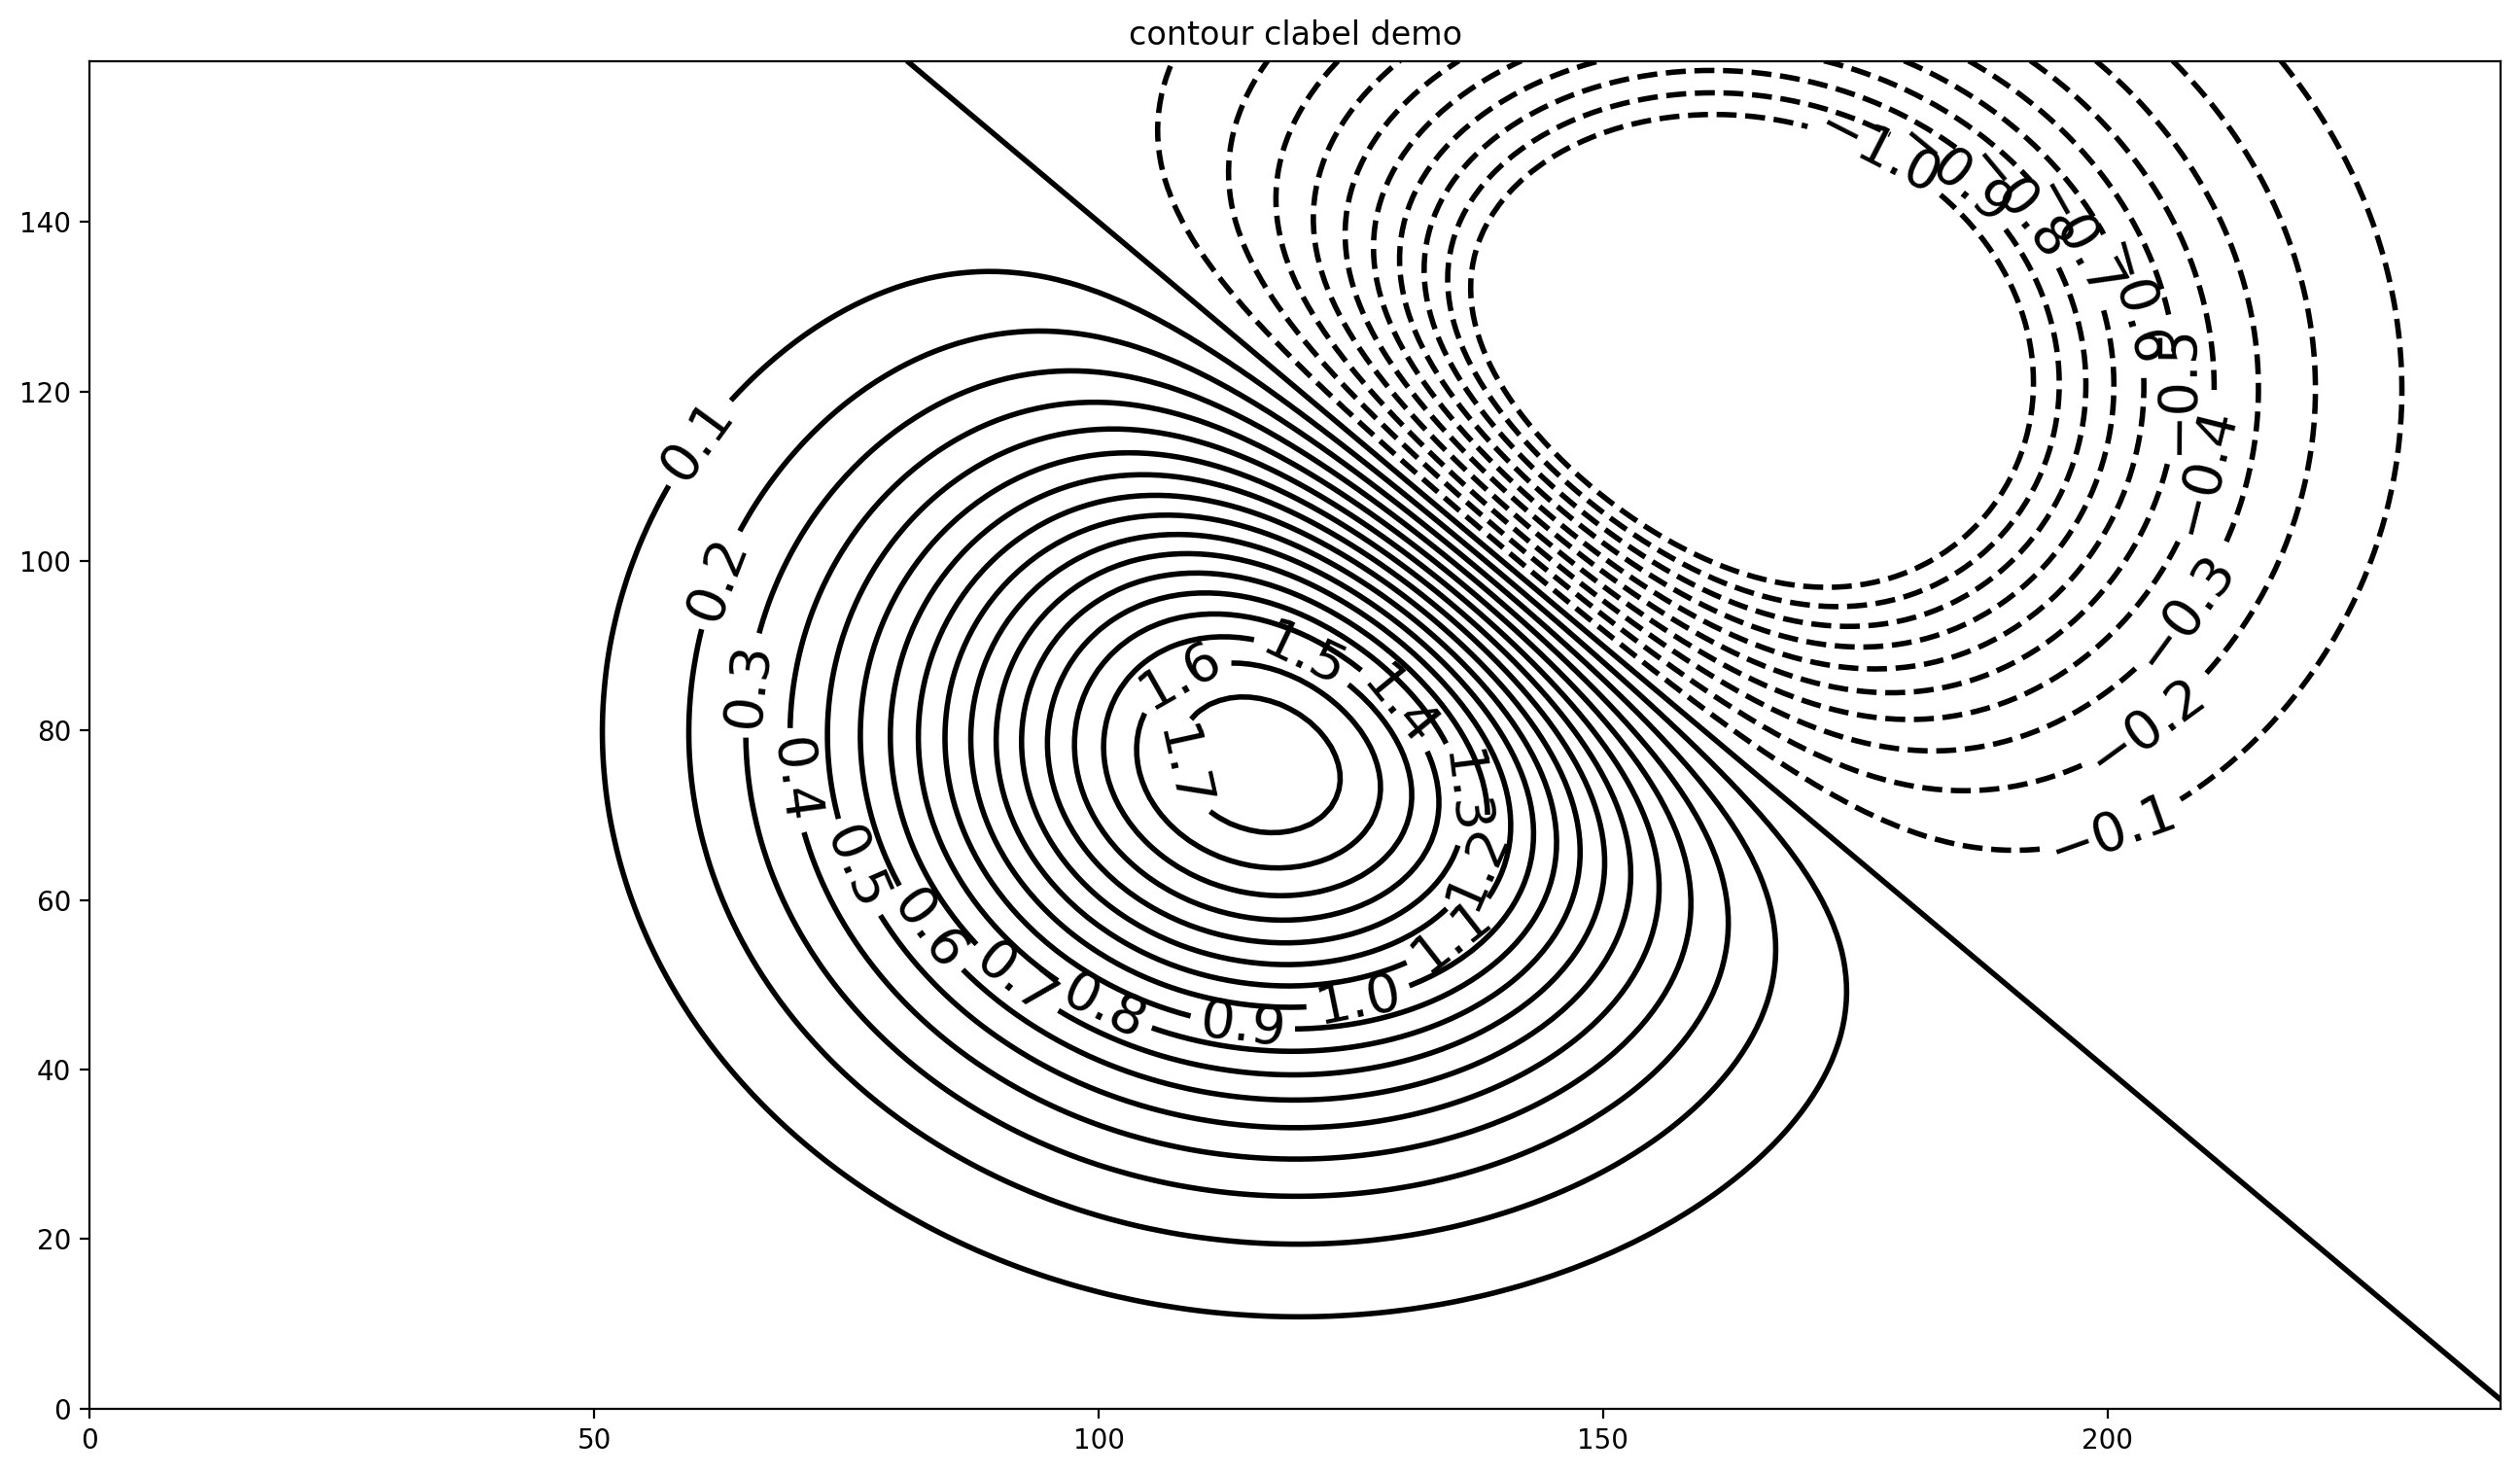
这样画出的图效果是这样:
默认打点
自定义打标签
如果我们想自定义标签的位置该怎么做呢?其实 Matplotlib 自带了交互式的打标签功能。
只要设置 clabel 的 参数 manual=True 就可以了。
修改后代码如下:
# -*- coding: utf-8 -*-
import numpy as np
import matplotlib.cm as cm
import matplotlib.pyplot as plt


# 创建等值线数据
delta = 0.025
x = np.arange(-3.0, 3.0, delta)
y = np.arange(-2.0, 2.0, delta)
X, Y = np.meshgrid(x, y)
Z1 = np.exp(-X**2 - Y**2)
Z2 = np.exp(-(X - 1)**2 - (Y - 1)**2)
Z = (Z1 - Z2) * 2

fig = plt.figure(figsize=(16, 9))

ax = fig.add_subplot(111)
# 等值线 LEVEL
levels = np.arange(-1, 1.8, 0.1)
# 绘制等值线
CS = ax.contour(Z, levels, linewidths=2, colors="black", manual=True) # 修改
# 打标签
ax.clabel(CS, inline=True, fontsize=20)

ax.set_title('contour clabel demo')
fig.savefig("test.png", dpi=200, bbox_inches='tight')
再次执行代码后,控制台会这样提示:
Select label locations manually using first mouse button.
End manual selection with second mouse button.
也就是说, 鼠标左键可以点标签,鼠标中键保存图片 。
注:
如果你绘制的是气象图,控制台还会多一句:
Remove last label by clicking third mouse button.也就是 鼠标右键撤销上一步操作 。
然后会自动弹出一个交互式的图像预览窗口,我们可以自行放大缩小图像,用鼠标在等值线上打标签。当你觉得标签的位置已经很满意时,按鼠标中键,图像就自动保存了。
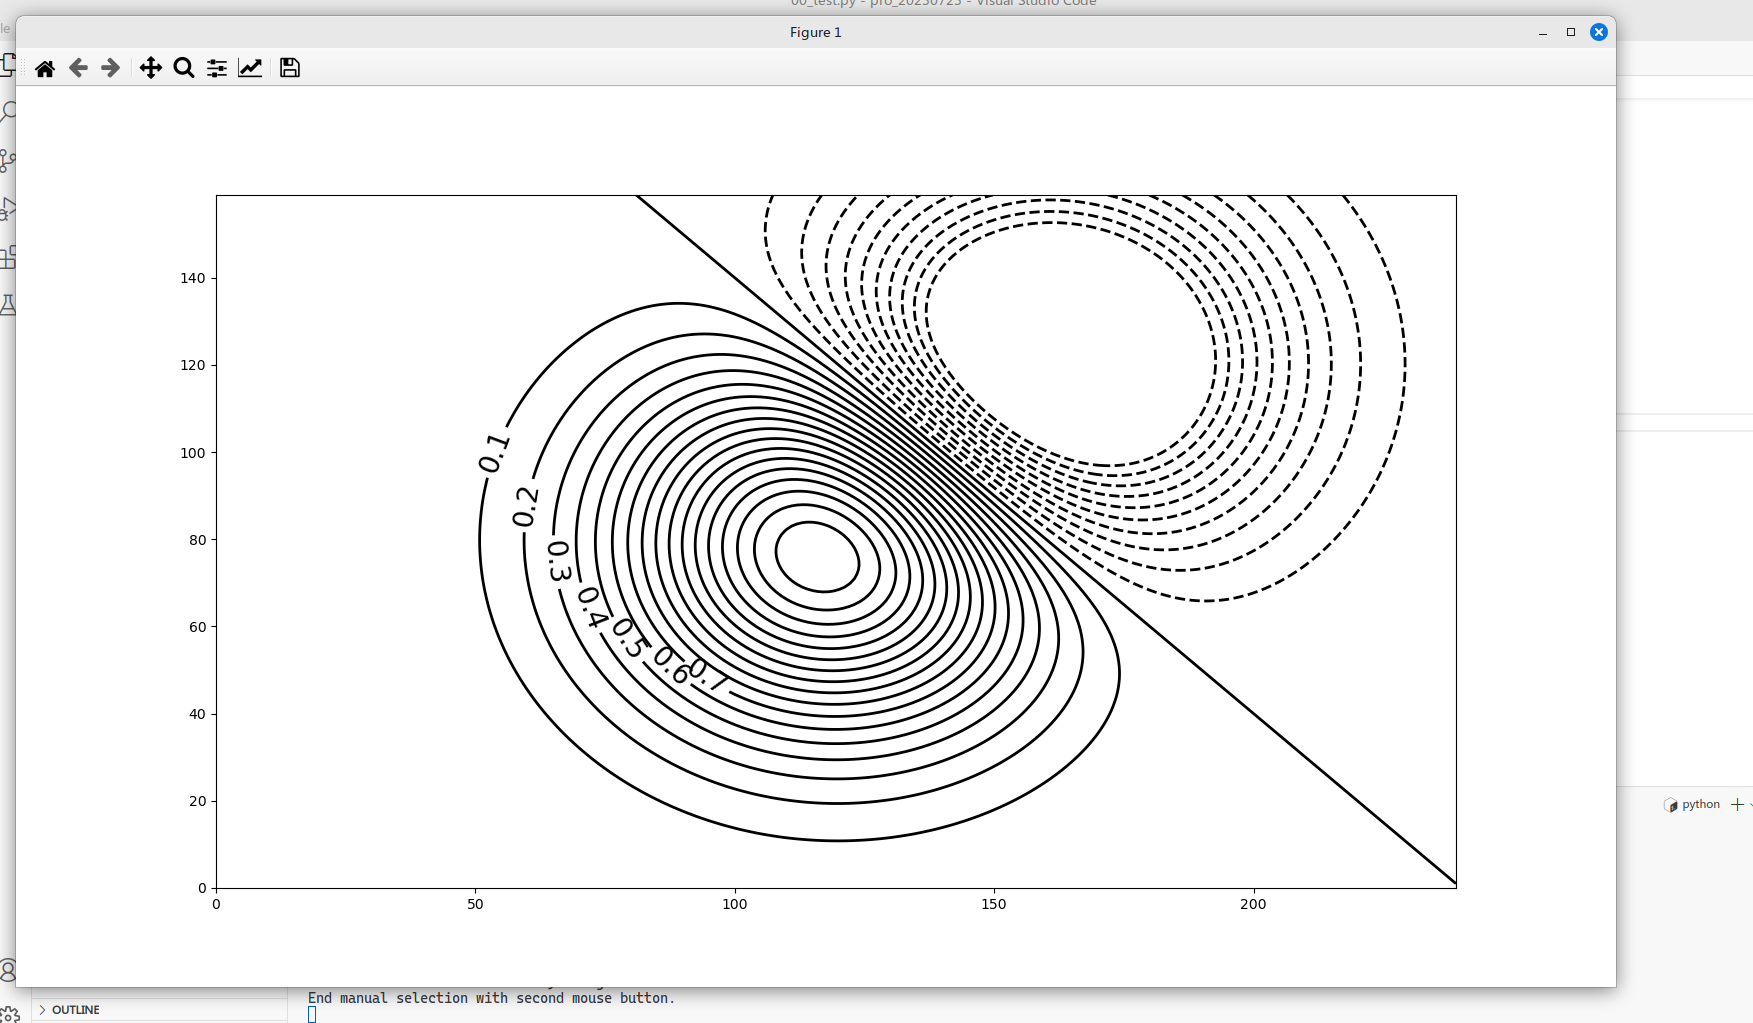
交互式窗口
用这个方法,就可以自定义标签的位置了。