Matplotlib Axes 的位置参数到底如何设置?
为了引出这篇文章想说明的问题,我们首先使用 Matplotlib 绘制一个简单的 pcolormesh 示例:
 1import os
 2import matplotlib as mpl
 3import matplotlib.pyplot as plt
 4import numpy as np
 5
 6mpl.use('Agg')
 7if os.popen("uname").read().strip() == "Darwin":
 8    mpl.rcParams["font.sans-serif"] = ["Arial Unicode MS"] # MacOS
 9else:
10    mpl.rcParams["font.sans-serif"] = ["SimHei"] # CentOS, Windows
11mpl.rcParams["axes.unicode_minus"] = False
12
13# 设置随机数种子, 使每次生成的数据集相同
14np.random.seed(19680801)
15
16# 构造数据
17Z = np.random.rand(6, 10)
18x = np.arange(-0.5, 10, 1)  # len = 11
19y = np.arange(4.5, 11, 1)  # len = 7
20
21# 创建 Figure 和坐标
22fig = plt.figure(figsize=(8, 6))
23ax = fig.add_subplot(111)
24
25# 填色
26img = ax.pcolormesh(x, y, Z)
27
28# 设置标题
29ax.set_title("Matplotlib pcolormesh 示例")
30
31# 绘制 Colorbar
32fig.colorbar(img, orientation='vertical')
33
34# 保存图表
35fig.savefig("test.png", bbox_inches='tight')
36
37# 关闭资源
38plt.cla()
39plt.close(fig)
40plt.close("all")
画出的图是这样的:
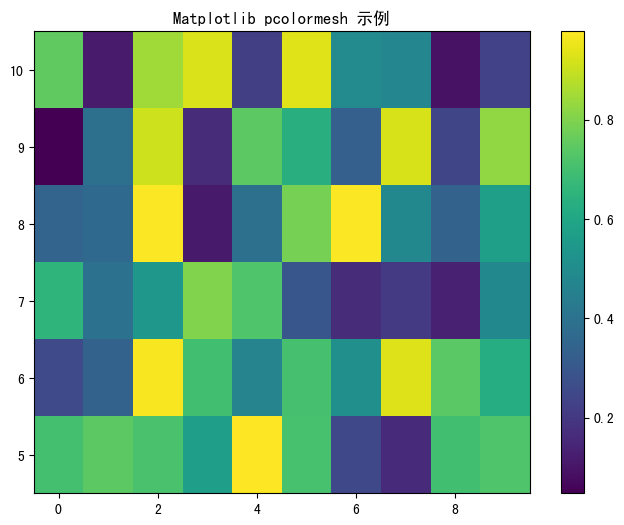
现在的 Colorbar 是垂直显示的。如果想要把它改成水平显示的,可以修改第 32 行代码中的 orientation
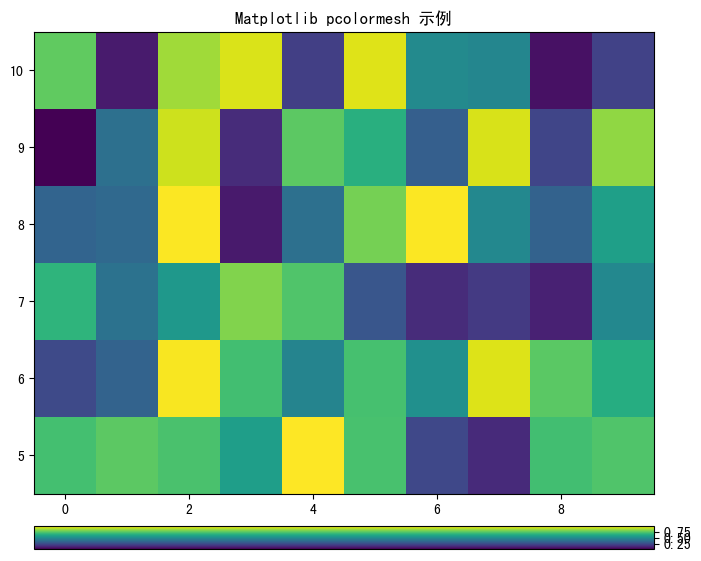
参数,改为 horizontal ,图片就会变成这样:
这两种位置都是 Matplotlib 内置的默认位置,但实际情况下,我们更希望能够自定义 Colorbar 的位置。 为了达到这一点,我们可以使用手动创建 Axes 的方式来设置 Colorbar。
按照下面的代码修改:
 1import os
 2import matplotlib as mpl
 3import matplotlib.pyplot as plt
 4import numpy as np
 5
 6mpl.use('Agg')
 7if os.popen("uname").read().strip() == "Darwin":
 8    mpl.rcParams["font.sans-serif"] = ["Arial Unicode MS"] # MacOS
 9else:
10    mpl.rcParams["font.sans-serif"] = ["SimHei"] # CentOS, Windows
11mpl.rcParams["axes.unicode_minus"] = False
12
13# 设置随机数种子, 使每次生成的数据集相同
14np.random.seed(19680801)
15
16# 构造数据
17Z = np.random.rand(6, 10)
18x = np.arange(-0.5, 10, 1)  # len = 11
19y = np.arange(4.5, 11, 1)  # len = 7
20
21# 创建 Figure 和 Axes
22fig = plt.figure(figsize=(8, 6))
23ax = fig.add_subplot(111)
24
25# 填色
26img = ax.pcolormesh(x, y, Z)
27
28# 设置标题
29ax.set_title("Matplotlib pcolormesh 示例")
30
31# 获取当前 Axes 的位置信息
32ax_left, ax_bottom, ax_width, ax_height = ax.get_position().bounds
33
34# 绘制 Colorbar
35cax = plt.axes([ax_left, ax_bottom - ax_height * 0.12, ax_width, ax_height * 0.05])  # type: ignore
36cb = fig.colorbar(img, cax=cax, orientation='horizontal')
37
38# 保存图表
39fig.savefig("test.png", bbox_inches='tight')
40
41# 关闭资源
42plt.cla()
43plt.close(fig)
44plt.close("all")
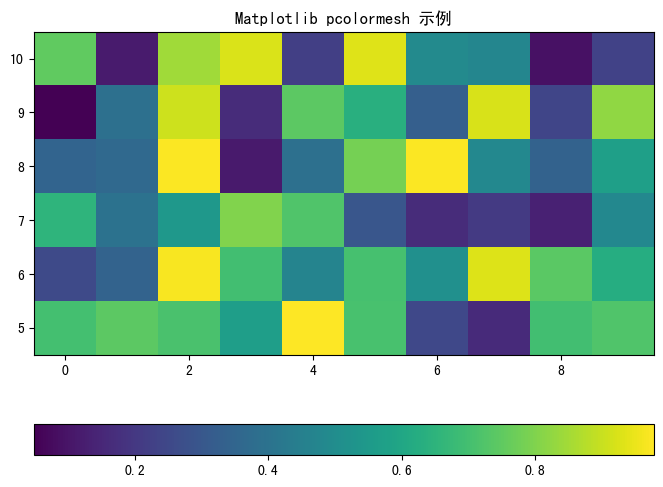
画出的图是这样的:
通过这种方式,我们就可以自由设置 Colorbar 的 位置 、 高度 、 宽度 等属性了,下面详细解释一下代码。
在 Matplotlib 中, Figure 表示 画布 , Axes 表示 轴 。
所有的图,不论包含的内容多么丰富,这两个组件一定是最基本的。
我们来看这张图:
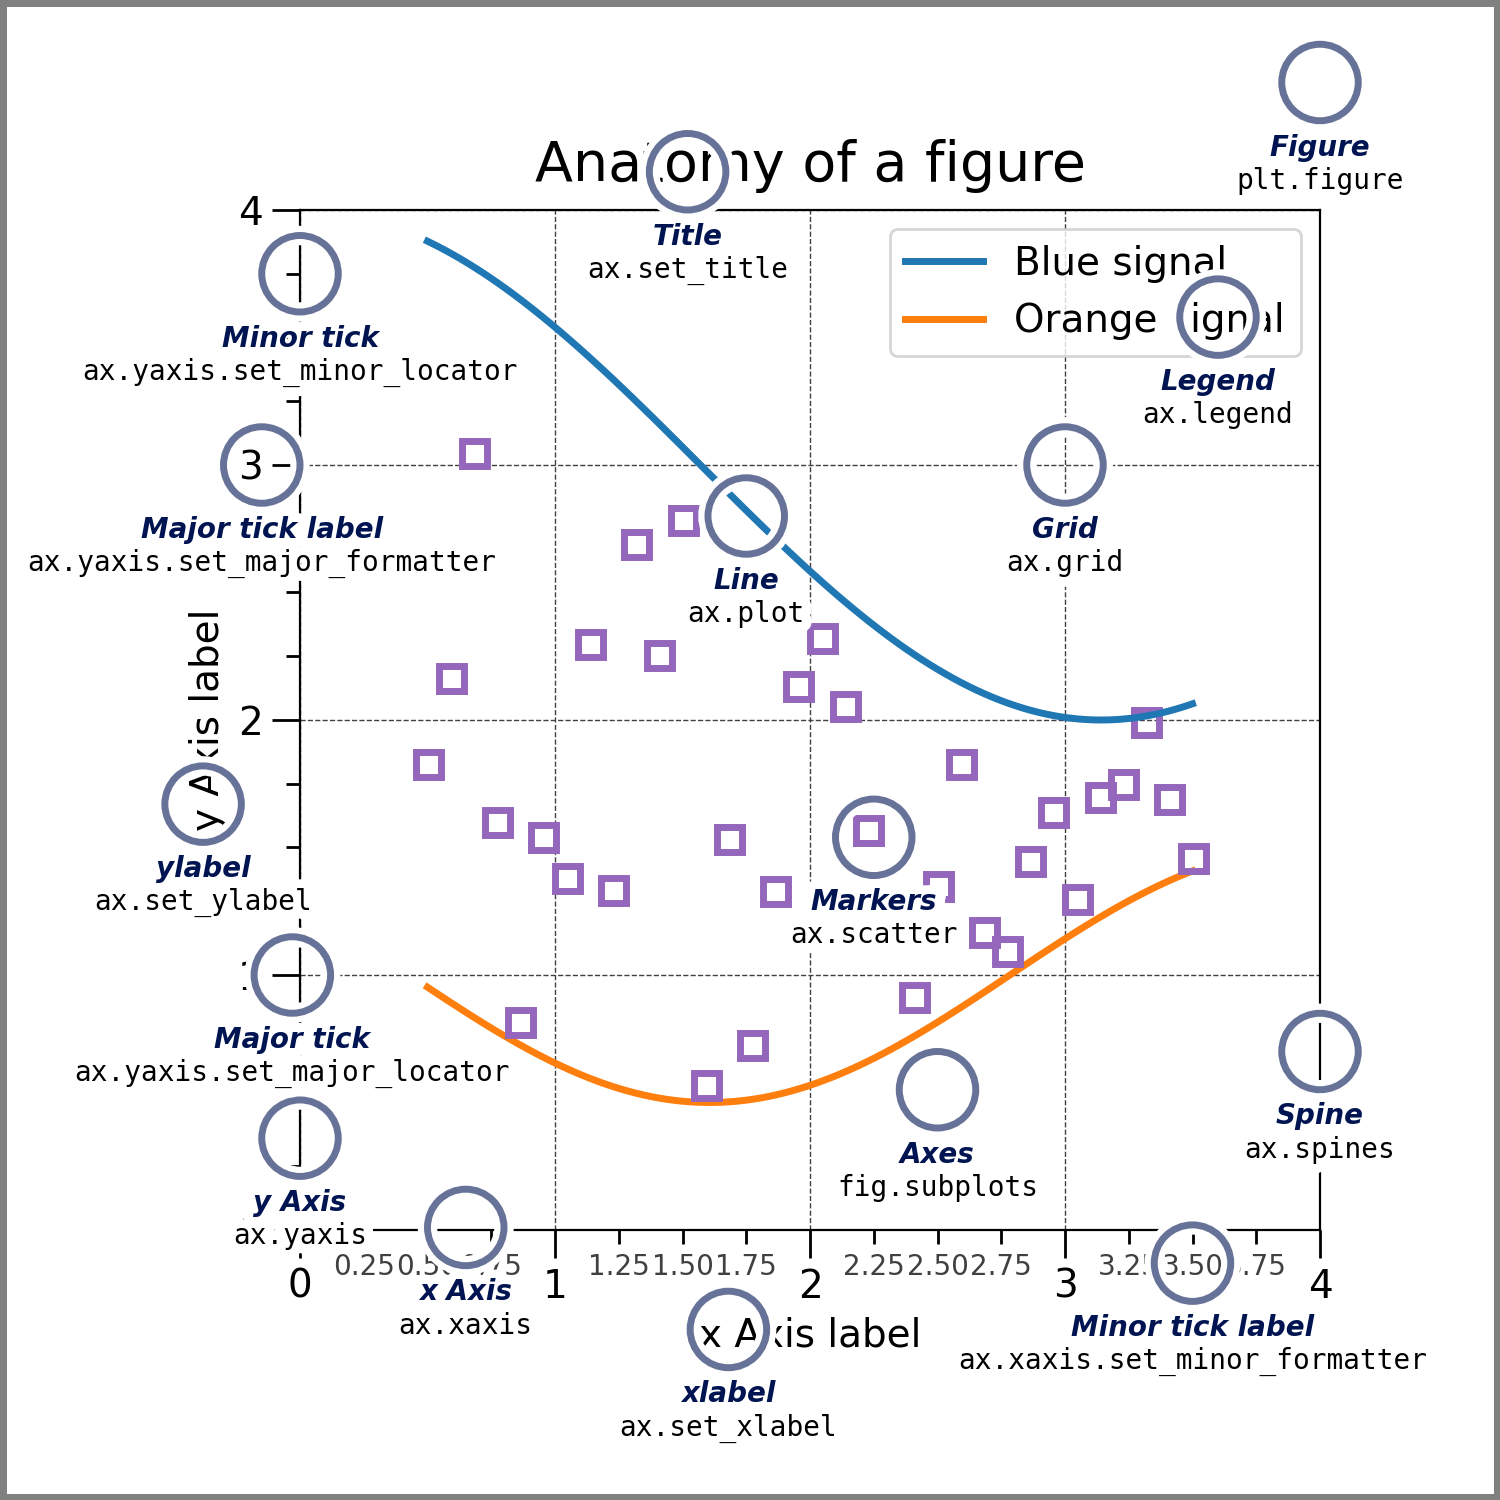
这张图展示了一张用 Matplotlib 画出的图的基本骨架,如果忽略那些 Marker、Label、Tick 等元素,其实最基本的就是 Figure 和 Axes。
先来看第 32 行:
1ax_left, ax_bottom, ax_width, ax_height = ax.get_position().bounds
这行代码获取到的四个变量分别为:
Axes 左侧边缘距离画布边缘的归一化距离:0.125
Axes 底部边缘距离画布边缘的归一化距离:0.10999999999999999
Axes 的归一化宽度:0.775
Axes 的归一化高度:0.77
归一化的数值大致相当于百分比。 比如 0.125 表示 Axes 是从 Figure 的 12.5% 处开始画的, 0.109 表示 Axes 底部到 Figure 底部的距离大致是 Figure 的 10.9%, 0.775 表示 Axes 宽度是 Figure 的 77.5%, 0.77 表示 Axes 高度是 Figure 的 77%。
然后再来看代码的第 35 行:
1cax = plt.axes([ax_left, ax_bottom - ax_height * 0.12, ax_width, ax_height * 0.05])
Matplotlib 官网有 plt.axes() 的函数签名。
其中第一个参数就是 rect=[left, bottom, width, height]。通过执行这个函数,我们创建了一个新的 Axes,rect 参数指定了它的位置。
我们在代码离这样写这四个参数:
1ax_left, ax_bottom - ax_height * 0.12, ax_width, ax_height * 0.05
意思是:
新 Axes 的左边和第一个 Axes 对齐。
新 Axes 的底部距离画布的距离,是第一个 Axes 高度的 12%。也就是说在与第一个 Axes 底部对齐的基础上,再向下移动它高度 12% 的距离。
新 Axes 的宽度与第一个 Axes 一致。
新 Axes 的高度是第一个 Axes 高度的 5%。
当创建好新 Axes 后,将它赋值给 colorbar 的 cax 参数,这样 colorbar 就直接在这个新 Axes 中填充了,它的形状就是我们定义的新 Axes 的形状。 如代码第 36 行所示:
1cb = fig.colorbar(img, cax=cax, orientation='horizontal')
所以,如果想要调整 colorbar 的位置,只要按照这个思路,把我们的目标位置转换为计算方式就可以了。
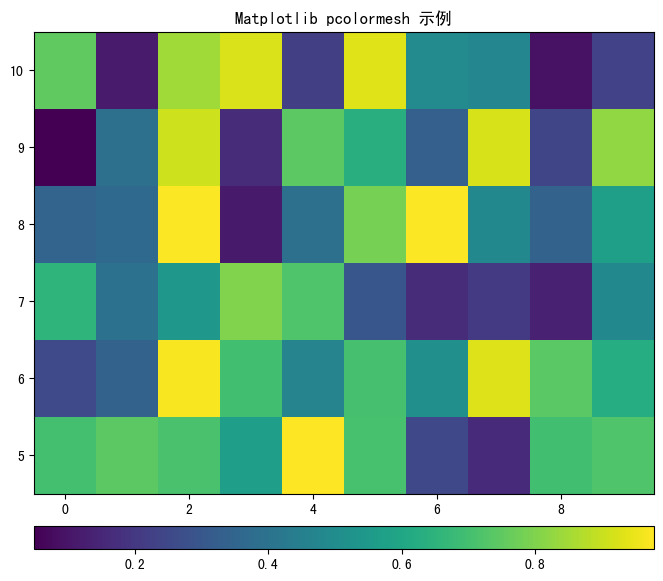
备注
另外还要注意,这四个参数要结合 orientation 来使用,当 colorbar 是垂直或水平时,它的宽度和高度也要相应的变换方向。 如果我们把现在的代码中的方向改为垂直,这样出来的 colorbar 就不对了,如下图: